
DOWNLOAD
DATE
MEET THE AUTHORS

Contact
WINNING THE STREAMING WAR
Think of the last streaming video service you cut. Was there a price hike? Did you burn through the only content you found appealing? Or were you just not watching it as much as other services?
If you trimmed streaming expenses recently, you are not alone. As reported in Forbes, the end of 2022 showed US consumers reducing streaming subscriptions, with just over 15% of Americans reporting as of December 2022 that they use no paid streaming services at all (up from 12.2% in October 2022).
So what’s behind the churn? Per Forbes, industry surveys offer two consistent answers: (1) content and (2) price sensitivity. In other words, the content is not good enough and it’s too expensive. But what does that really mean? And what do you do about churn if you’re helming a streaming service today?
Arthur D. Little (ADL) argues that both reasons for the churn stem from a single cause: perceived subscription value. That is, does the viewer feel the content is worth the price.
Subscription video on demand services (SVODs) are responding in multiple ways to increase value and right-size pricing: spending more on must-have content, adding new categories like games and sports, consolidating subsidiaries, and shifting price tiers, including ad-supported tiers. All these methods affect the actual value of the subscription: users will get more for what they pay or they won’t have to pay at all.
As providers struggle to retain users, one game-changing approach that affects perceptions has been ignored: user experience (UX). Usually relegated to the “nice to have” column of streaming excellence, UX — which encompasses everything from login flow to search to carousel display — actually is at the heart of perceived subscription value. With the glut of titles and options, SVODs must stop to ponder what users actually want from their viewing experiences and how to design their services to deliver against those desires.
While SVODs stockpile more and more content, users must be able to easily find and watch the content they want among the morass of titles with an app that performs reliably. A first-time user should be able to quickly find their way to shows that will keep them hooked, not get turned off by hours of scrolling that lead to an abandoned title five minutes in.
Users will increasingly look to streamers to curate and simplify the viewing experience, while merchandising all the other content that will justify a recurring spend. As consumers scrutinize streaming expenses, designing a winning UX and continually innovating will not just be window dressing, it may be the whole house.
WHAT IS UX FOR STREAMING?
We’ve all had frustrating streaming video experiences like videos that take forever to start or apps that make you jump through hoops just to continue watching something you previously started. In the past, Internet service providers shouldered a lot of the blame for poor viewing experiences, but faster home and mobile broadband speeds have alleviated many of those issues. Simply stated, some streaming apps are easier to use and work better than others, and this situation will help determine the success of major streaming providers.
UX quality for streaming services falls into two broad categories:
-
Performance — does it function properly and as a user generally would expect?
-
Ease of use — is it simple and intuitive for a user to perform functions?
Let’s consider both categories to better understand key elements for a high-quality UX.
Performance
Leading metrics for performance include:
Watching videos
-
App crashes
-
Time to launch app
-
Buffering at start of or within video
-
Video crashes
-
Pixelation
-
Audio quality (volume, distortion, gaps)
Advertising
-
Ad start failures
-
Time/buffering to launch sequential ad
-
Repeated ad(s) in same break or throughout session
-
Video crashes within or when exiting ad break
Ease of use
Ease of use is more subjective but stands out on a relative basis when comparing competing services. Key elements include:
-
Discovery process when searching or browsing
-
Transition between episodes in a series
-
Ability to resume watching content in a new session
-
Relevance of content suggestions
-
Login process
These UX elements matter. In fact, Criteo reports that 40% of consumers indicate that a smooth and steady streaming experience is important when picking between streaming services, and over 30% point to the importance of a user-friendly interface. Conviva data from 2022 shows that ad start failures occurred in 13% of cases in its global sample of error rates, and viewers exited before ad starts in 4% of overall cases (see Table 1). These results indicate exits of around 30% when an ad fails to start, which is consistent with long-standing video exit figures for other metrics such as video start failures.
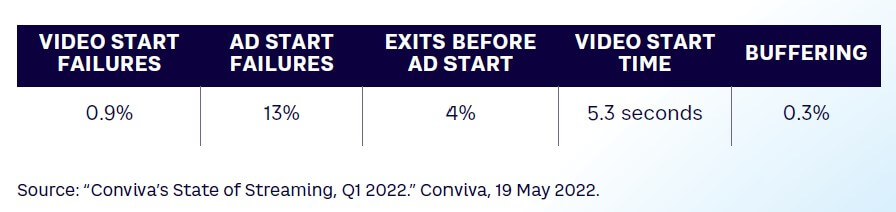
Error rate is just one of many elements that can drive viewer exits or marginal decisions between services they browse when looking for a new show or movie to watch. Even though the video start failures in Table 1 are less than 1%, this is an average, meaning many providers are worse. In addition, even 1% implies billions of minutes of lost viewing.
ADL has conducted audits of streaming services and found wide variances in UX across providers and across platforms and devices for individual providers. The inconsistency is not surprising considering the number of apps that product teams must develop and maintain across platforms. With a slowing of subscriber growth, streaming providers should invest in UX improvements to avoid much more costly subscriber losses. In the coming months, ADL will be auditing the UX of leading services to highlight best practices, contrasts between services, and opportunities for improvement and will share the findings in future Viewpoints.
Unlock a Powerful Difference
RELATED INFORMATION

Arthur D. Little Studie: Digitalisierung sichert Medienbranche weiteres Wachstum
Die weltweite Medienbranche befindet sich auf Wachstumskurs - lediglich in Europa werden traditionelle Medienkonzerne mit sinkenden Umsätzen kämpfen müssen. Steigende Kosten für Inhalte haben bereits…

The Business Benefits of 4G LTE
The latest such technology, 4G LTE (‘Fourth Generation – Long Term Evolution’),provides substantial performance improvements over previous mobile technologies, and offers the promise that…

Creating a High Performance Service Organization: A Case Study
In recent years, quality management techniques have once again captured the imagination of management in industries around the globe. However, while the techniques have a ready and obvious use in…