22 min read • Travel & transportation, Organization & transformation, Strategy
Public transport fare models
The right moment to revisit fare models & help transport authorities cope with challenges

Executive Summary
Since the COVID-19 outbreak and the war in Ukraine, the public transport funding equation has been challenged by new ridership patterns (impacting traffic and the level of adoption of subscription-based fares), inflation (raising the cost of operations), and an acceleration in the development of alternative transportation options (owned or shared). While price increases in public transport fares have been limited so far, we believe there is an opportunity to revisit fare models, as public authorities increasingly show a willingness to support multimodal integration and ticketing digitalization enables innovation in pricing and marketing. This Report identifies the need for public transport authorities (PTAs) to reassess fare models, leveraging digitalization and an increased willingness for alternative transportation models, and explores the following:
-
Public transport goals and potential measures. We discuss fare collection’s share of public transport financing and key levers to increase attractiveness for the transport network. We highlight some key considerations for PTAs when developing a fare model, while also keeping in mind that a model is just one of the tools a PTA has at its disposal to achieve goals.
-
Strong momentum for fare strategy redefinition. Recent events have increased the pressure on the public transport funding equation. With increasing operational costs, environmental transitioning, shared mobility, and integration of additional modes — alongside technlogical advances and changes in travel behavior following the pandemic — it is high time to revisit fare strategy, which for many PTAs has remained unchanged for a long time.
-
Fare models and adjustment factors. For a common vantage point for discussion, we present our definition of a price model and its design components. Furthermore, we provide an assessment of the general characteristics of the most common price drivers, including geographic zone–based models, distance-based models, personal zone–based models, and flat fare models. We also discuss the most common adjustment factors, loyalty factors, user types, and time and mode differentiation.
-
Designing an ideal fare model. Finally, to help PTAs design their ideal fare model, we present a five-step framework that provides a systematic approach to navigate the process effectively.
The Report emphasizes the array of benefits and drawbacks inherent in various price drivers and adjustment factors, offering PTAs a broad spectrum of options to construct their ideal fare model.
1
PUBLIC TRANSPORT GOALS & POTENTIAL MEASURES
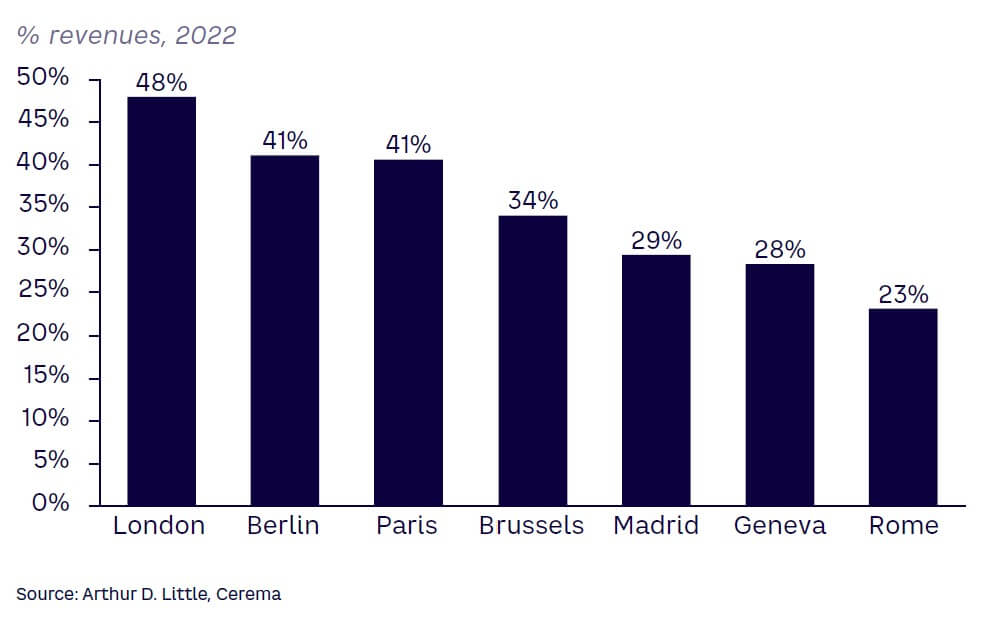
The fare model is the core of any public transport network. In fact, fare collection often contributes as much as 20%-50% of the financing of urban transport network operating costs (see Figure 1). Affordability, readability, and simplicity of fares are levers for greater attractiveness.
A fare model for public transport should be designed in consideration of the mobility system’s goals, capabilities, and constraints. Although local variations exist, the overall public transport goals are generally the same for PTAs around the world: to make mobility more environmentally friendly and provide simple, safe, and predictable travel in an efficient manner. These goals are balanced against the cost of operation and public funding to provide the services.
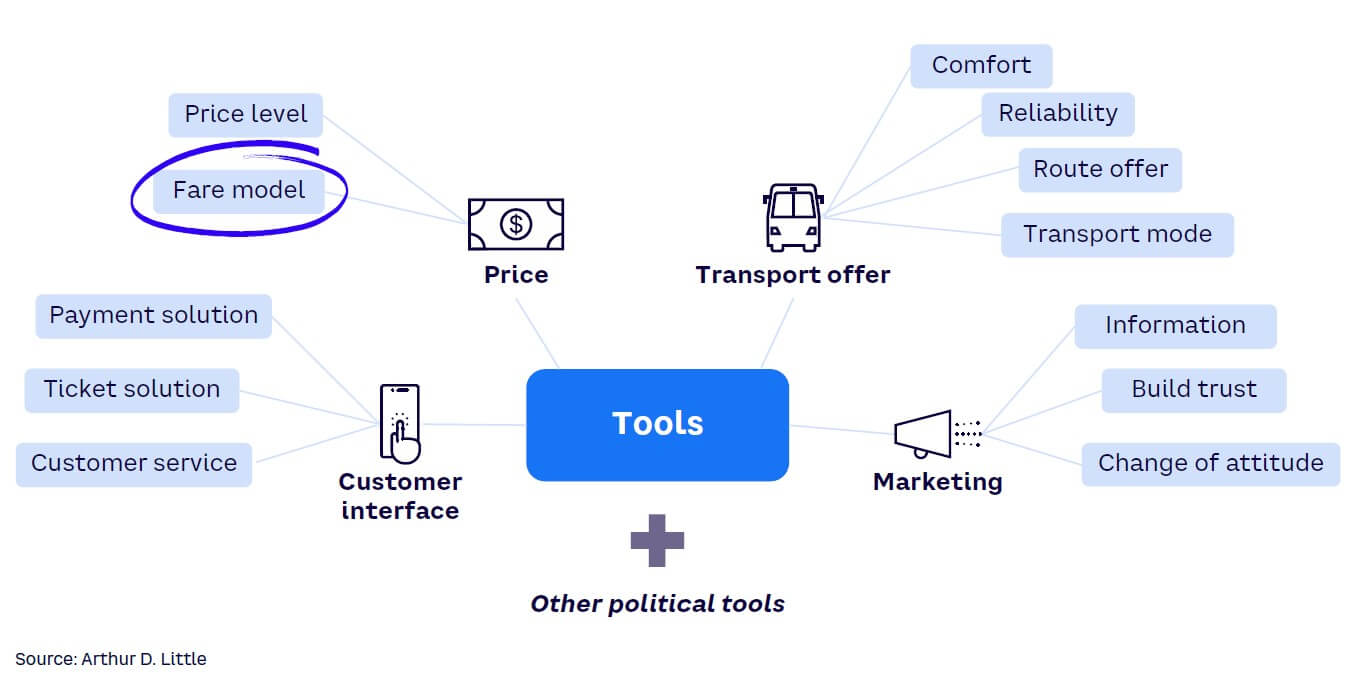
While fare models can support the achievement of public transport goals, it is only one of many tools PTAs have at their disposal (see Figure 2). PTAs should therefore consider the available options based on what goals they want to achieve with their fare model, as no model is equipped to solve every challenge. For example, a typical conflict when discussing fare models is the trade-off between optimizing user behavior and simplifying the journey, since optimization often also adds complexity.
The capabilities of both the PTA and the users, together with the regulatory landscape, will set the boundaries for what solutions are possible for all aspects of the journey, including payment and ticket solutions, validation technology, and fare models. Many solutions are interconnected, so mapping the options based on the current solutions is important to understand what fare models are possible.
2
STRONG MOMENTUM FOR FARE STRATEGY REDEFINITION
CURRENT STATE OF AFFAIRS
There is strong momentum to revisit fare models given the ongoing funding challenges, expanded digitalization, changing mobility landscape, and evolving travel patterns. In recent years, the public transport funding equation has faced various challenges, including:
-
Rising operating costs. Since 2022, Le Parisien reports that PTAs and public transport operators (PTOs) have faced increasing operating expenses due to increases in energy prices (an increase of 1.6x for Paris Metro) and the impact of inflation on labor costs (an increase of 5.2% in 2022 for Paris PTO RATP Group) that could lead to increases in the hundreds of millions of dollars (an increase of US $219 million in OPEX in 2022 and $222 million in the first half of 2023 for RATP).
-
Green transition. In the medium term, different transportation networks will have to support higher investment to finance the green transition (e.g., bus fleets are expected to convert to electric, which may translate to higher CAPEX but lower total cost of ownership).
-
Changing scope of financing. PTAs in some regions are financing shared mobility (e.g., the integration of carpooling in the subscription-based product Navigo in Paris, France), though it comprises a low portion of the funding equation.
-
Integration of fares between modes and networks. Increasingly, PTAs and PTOs are seeking to integrate national, regional, and city-based transportation fares (e.g., Switzerland’s integrated fares system, Germany’s new Rail Pass, and upcoming projects in France that integrate regional trains and urban networks).
The available technology is also continuously evolving, affecting several aspects of the public transport journey. In our 2020 Arthur D. Little (ADL) Viewpoint “Dematerialized Ticketing,” we wrote about how server-centric ticketing allows the introduction of innovative pricing schemes as customers can be billed once they have completed their trips. The use of big data, artificial intelligence, and machine learning will allow more accurate predictions of customer behavior and improve several aspects of travel, including route optimization, the use of materials, safety, and the personalization of services. Within validation technology, Check-in/Be-out (CiBo) and Be-in/Be-out (BiBo) ticketing systems are continuously tested and can open the door for new pricing schemes once they become commercially viable, as models that previously required several interactions can now be automated.
The mobility landscape is increasingly being viewed as a single system. Going forward, we expect to see greater system integration. For public transport, this will likely mean integrating additional transport modes such as electric scooters for first/last-mile transport and eventually a fully integrated mobility-as-a-service network. For PTAs, this is a vital trend from a sustainability perspective to effectively fight the dominance of personal vehicles.
Finally, societies are returning to normal following the COVID-19 pandemic, when public transport was significantly affected by lockdowns, social distancing, and hygiene requirements. As societies reopen, most observers agree that at least some of the changes in behavior are expected to endure, as covered in the ADL Report “The Future of Mobility Post-COVID.” Among the expected lasting trends is the evolution of trip patterns, as customers are expected to repurpose, retime, and respace their travel patterns. With increased work from home expected to last to some degree, we anticipate customers will continue to repurpose their trips from work travel to more travel for home needs, respace their trips to shorter local trips, and use the increased flexibility to retime their trips by taking fewer trips during peak hours. This trend has a significant impact on what loyalty factor is the ideal choice for a transport network, but our analysis has shown it has less importance for the choice of price driver in the fare model.
3
FARE MODELS & ADJUSTMENT FACTORS
CONTENTS OF A FARE MODEL
To define a fare model, we begin with how the fare price of a journey is calculated. Fare calculation starts with a price driver, which is subsequently fine-tuned by one or a combination of adjustment factors, including time differentiation, user type, loyalty, and mode (see Figure 3).
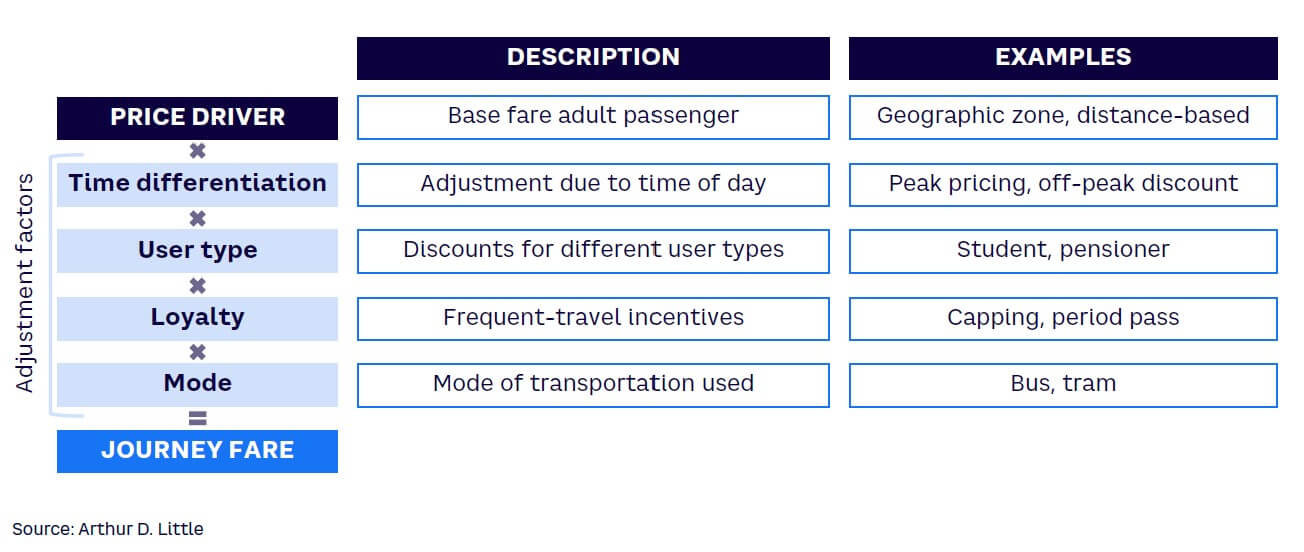
A model’s price driver calculates a journey’s base fare (typically, the fare for an adult passenger). Depending on the model, the base fare would often have a variable component (distance/time/number of zones) and possibly a fixed component (starting price). The base can then be adjusted by a series of factors. The number of adjustment factors in a fare model varies, but a few are far more common and are the focus of this Report. In the following section, we discuss the pros and cons of the most common price drivers and adjustment factors.
In addition to the internal factors of a fare model, external factors also influence what models a PTA could utilize. A public transportation network’s characteristics (e.g., size, hilliness, congestion, and more) will influence what options are viable. The network’s financing model and its contributors will also influence the process and will likely guide the choice of fare model.
PRICE DRIVERS
The four price drivers we cover can be designed in several ways, but we aim to highlight the most general characteristics in this Report. Each driver comes with its own set of pros and cons but are all used in cities around the world in different combinations (see Figure 4).
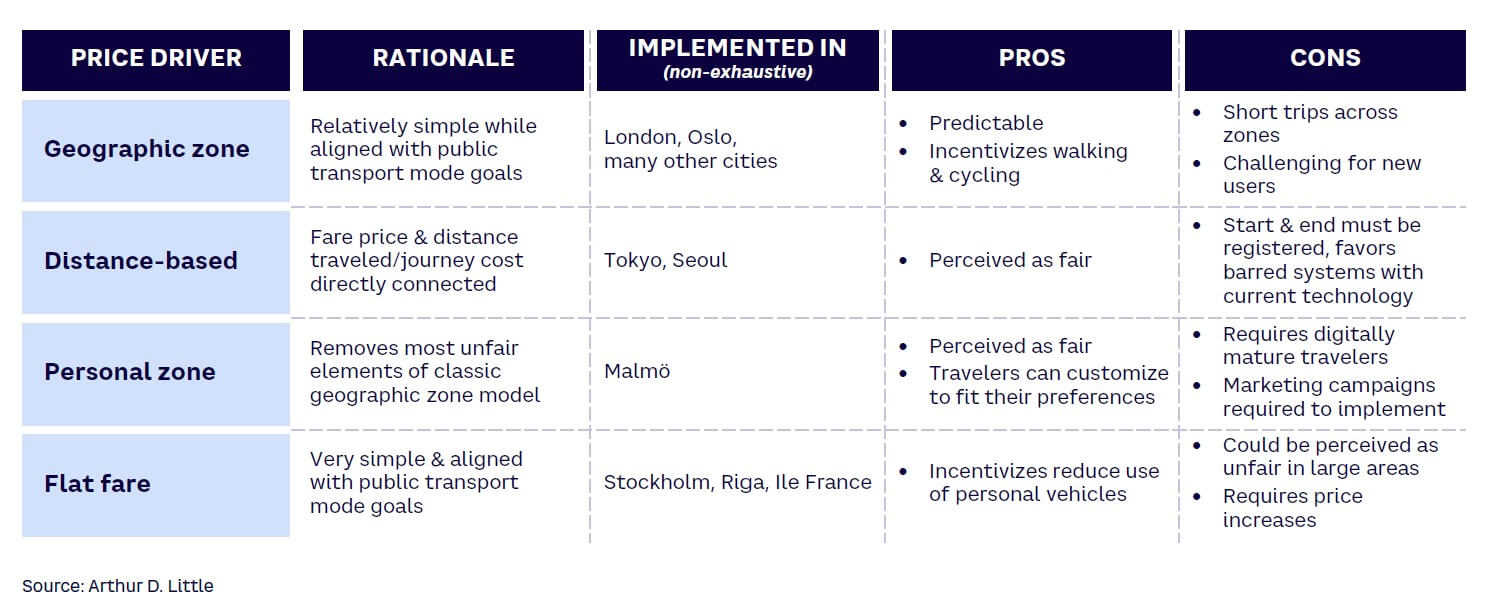
Geographic zone
In a geographic zone–based model, the area is divided into separate geographic zones, typically centered around the area of the city that attracts the most trips. The traveler buys a ticket based on the number of zones that their trip covers.
This system is widely used around the world. It is predictable for consumers, as daily journeys will have the same fare, but can be challenging for passengers who don’t travel regularly, including tourists. To buy the correct ticket, a passenger must know where the zones are placed and where stations are located, which could be challenging for passengers unfamiliar with the system.
Another characteristic of this model is that short trips are relatively expensive compared to longer trips, as all trips within the zone cost the same. If the zones are large, one can travel longer distances for the same price as for a journey between two stations. This can be viewed as unfair by the travelers, but it also incentivizes journeys by walking and cycling on shorter distances and reduces the incentive to use personal cars on longer journeys, in line with public mobility goals. The position and size of the zones are important decisions when implementing the system, as changing the zone boundaries are difficult once they are established. Having more zones reduces the difference but also increases the system’s complexity and makes it harder to choose the correct ticket. This has been the argument for many mobility systems, as cities like Helsinki and Belgrade have reduced the number of zones in recent years.
One clear disadvantage is shorter trips across zone boundaries. Consumers starting their trips close to the edge of a zone will pay an unreasonably high price for short trips, both compared to the cost of the trip and compared to other passengers, which is perceived as unfair. However, there are ways to resolve this issue. For example, in the zone model implemented in Helsinki in 2019, all tickets cover at least two zones.
Distance-based
In a distance-based model, the fare and distance traveled are directly connected. The model typically calls for a minimum price in addition to a price per mile or kilometer, which could be regressive.
Distance-based fare models can be based on the actual distance traveled or the “air distance” (distance between two places drawn in a straight line) between the starting and ending location. Both are perceived as fair by consumers as they pay only for their actual consumption. The models are also connected to the variable costs of operation, especially models using actual distance traveled. This aligns the interest of the consumer and producer to a larger degree.
The differences between the two model options are minor. A downside for using a model based on actual distance is that consumers can perceive it as unfair for transport options that do not take the most efficient route, which increases the fare. Similarly, air distance models could see consumers pay significantly less than the actual distance traveled if the route contains detours and therefore does not reflect the journey’s production cost.
A downside for both models is that both the start and end positions must be registered for every journey in order to calculate the correct fare. This makes the model more suited for barred systems (where physical gates are present) using currently available technology. When technology for automatic registration of journeys like CiBo/BiBo becomes commercially viable, the customer experience in an honor-based (non-barred) system would significantly improve.
Personal zone
A personal zone model can be viewed as a mobile geographic zone model or a distance-based model, with larger distance intervals. One such model was introduced in 2017 in the Skåne region in Sweden, which includes the city of Malmö.
In general, a passenger is given a personal zone with a radius in which he or she can travel. Travel to a destination outside the zone has a higher price, similar to crossing a boundary in a geographic zone–based model. The difference is that the zones are based on the individual passenger instead of set positions.
One advantage of this model is that passengers won’t cross any boundaries during short trips, which can happen with static geographic zones. The size of the personal zone can also be adjusted based on the area of origin, as trips in rural areas are generally longer in distance than densely populated areas. The zone could either be bound to the person or to the individual ticket. If connected to the person, travelers could customize the model to fit their own preferences, placing their personal zone in the area most beneficial for them.
Digital maturity is important in implementing this model, as it is difficult for customers to know where the boundary of their personal zone is without a mobile ticket. Another challenge is that passengers may not be aware of the length of their trips and whether their daily commute will require a ticket valid in one or more zones. In total, the model requires high-quality interfaces, support, and publicity to implement.
Flat fare
In a flat fare model, there is a single price for tickets valid in the entire area of operation. The major upside of this model is the simplicity, which is the main argument for PTAs that have implemented it, including Stockholm. In Germany, PTAs have even introduced the Deutschlandticket, which provides access to public transport throughout the country.
Depending on the size of the area, the flat fare model gives customers the chance to travel long distances for a relatively low price, while charging the same price for short trips. This model aligns with many PTAs’ goal of increasing the share of travel by bicycle and walking while reducing the market share of cars.
Another argument in favor of this model is that short trips most often occur in urban areas, where the travelers have access to a vast array of travel options and modes with frequent departures, while trips in rural areas are typically longer, less frequent, and involve less efficient modes of transport. However, if the area of operation is of a significant size, the relative price difference for long trips would be disproportionally large and hence may be perceived as unfair.
A way to mitigate this price difference is to add a time limit to tickets, which hinders the option of traveling across the entire area. The traveler then must buy another ticket if his or her trip exceeds the limit, functioning similarly to a zone boundary in a geographic zone model. The advantage of this model is simplicity. There is only one price for the traveler to be aware of, as well as the potential time limit. The purchase of a second ticket could be done when needed, and alerts or similar solutions could make the traveler aware of additional purchase requirements.
The simplicity, however, often comes with a minor increase in price for most journeys compared to employing more complex models. This is because there is less price differentiation in the model, bringing all prices closer to the mean. Our customer survey implies that customers welcome the simplicity of a flat fare model but are concerned about the potential price increase on short journeys, which would affect most travelers.
ADJUSTMENT FACTORS
Most PTOs use adjustment factors in their fare models. The most common types are loyalty benefits (adjustment factors that reduce the price of travel based on frequent journeys) and user type, but in this section, we also discuss some less frequently used adjustment factors (see Figure 5).
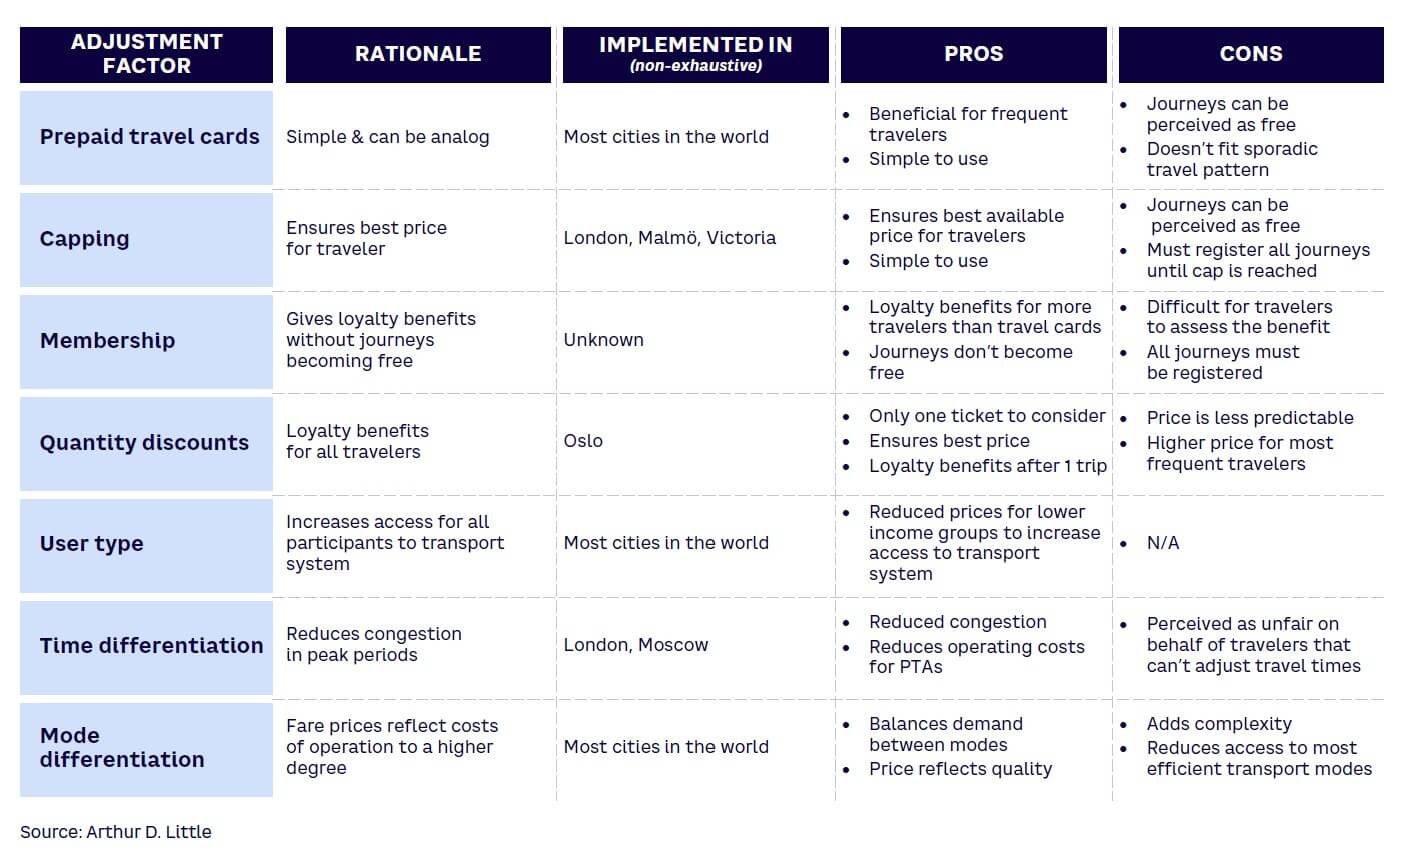
Prepaid travel cards
Prepaid travel cards are still the most common form of loyalty, giving the passenger unlimited journeys for a set period. Alternative durations are typically offered, ranging from 24 hours to 365 days, but the 30-day pass is the most widely used. The prepaid travel card is very easy to use and doesn’t require validation for every journey in a non-barred system and provides an attractive offering to frequent travelers due to the high discounts that are possible.
At the same time, prepaid travel cards have some well-known downsides. The pandemic and associated increase in working from home demonstrated that this form of loyalty is less well-equipped to incentivize a more flexible and unpredictable travel pattern. To garner loyalty benefits, the traveler must know in advance that he or she will travel a certain number of trips in the coming period, which can make it difficult for users to determine the investment’s worth. High up-front costs also make it difficult for low-income groups to utilize the system. The final downside is that journeys could be perceived as free, increasing the portion of short journeys that could have been taken by bicycle or on foot instead, increasing congestion in public transport.
Capping
A fare-capping model has been introduced in many cities around the world, including London, Malmö, and Victoria. The model sets a maximum amount a traveler can spend per day/week/month, effectively functioning as a prepaid travel card once travelers have reached their cap. Its effect on travel behavior is also similar to the prepaid travel card model, with some differences.
One advantage of fare capping is that travelers don’t need to determine in advance their travel needs for a given period. The cap ensures that customers always receive the best price possible. Like the prepaid card, it also gives a significant benefit to the most frequent travelers, as every additional journey beyond the cap is free.
However, the added benefits do add some complexities. In non-barred mobility systems, travelers would have to purchase a ticket at every journey until they have achieved the cap. Our simulations also show that implementing a cap compared to prepaid travel cards requires a minor increase in prices to maintain the same revenues. This is a result of travelers who miscalculate their travel needs and therefore purchase non-optimal tickets. Also, some travelers are willing to pay a little extra for a prepaid ticket to avoid purchasing a ticket at every journey.
Customers generally perceive capping as a suitable alternative in times where their travel needs are uncertain, but in a non-barred system, they are reluctant to having it as the only loyalty alternative, as they enjoy the simplicity in the prepaid card and don’t want to purchase a ticket at every journey.
Membership
For some time, a membership model has been considered for public transport, but to our knowledge it has not yet been implemented in any mobility systems. With a membership, travelers pay a monthly amount to access cheaper single fare tickets. While most changes in recent years have been in the direction of simplification, a membership model would instead focus on optimization, but it comes with an added layer of complexity.
Assessing whether a membership is worth the investment is harder than assessing a prepaid travel card, since it includes the cost of subsequent journeys. This was evident in our customer surveys, where many respondents were confused as to how the model would work. Similar to capping, the model would also require a ticket at every journey, which is a hurdle for travelers in non-barred systems.
The benefit of the model is that more travelers enjoy loyalty benefits. Our simulations showed that with a membership costs 50% lower than a prepaid travel card, single ticket prices could be reduced by 80%. This significantly reduced the prices for customers taking two to three journeys a week without necessitating a significant increase in prices for more frequent travelers. The model increased the market share of public transport compared to cars, since longer journeys became cheaper, while also increasing the market share of walking and bicycles because every journey, including the shortest, had a price.
Quantity discounts
The final loyalty factor we will discuss is quantity discounts. Prepaid single ticket quantity discounts have been common in mobility systems for some time, but with developing technology, more advanced, seamless pay-as-you-go alternatives have become available. In our simulations, the quantity discount model was designed to give an increasingly higher discount for each journey taken within a given period. This required the travel card to be connected to an account to register the benefits.
The model’s advantage is that every traveler taking more than one journey during the time period achieves loyalty benefits. To maintain income levels, however, this means that the most frequent travelers had an increase in price, even with quantity discounts as high as 80%. The low amount of journeys needed to attain a sufficient discount proved to outweigh the cost of the prepaid travel card. Similar to capping, the model also secures the best possible price for every traveler.
Again, the model also requires the purchase of a ticket at every journey, and the price of the journey becomes less predictable. This means that the model is better suited in a system where journey registration occurs automatically.
User type
Another adjustment factor that most transport systems use are discounts for different user types. This could be tickets for children, students, senior citizens or pensioners, or another group, increasing access for these participants to the public transport system. User type discounts are generally assumed in mobility systems, but one user type discount has received some debate in recent years. Historically, senior citizens were among the lowest earners in most countries, but with the increase in living standards and property prices in recent decades, pensioners are now among the wealthiest groups in many countries. The question of whether senior citizens need an added discount for public transport services has therefore been a point of discussion; however, our simulations show that changing the discount for pensioners has a low overall impact on the mobility system, and removing the option is perceived negatively.
Time differentiation
A more controversial factor, which some cities have introduced and that could become more popular in the future, is peak pricing, or time differentiation. Nudging travelers to off-peak journeys both reduces congestion and is financially beneficial for the system because peak hours often require additional capacity that is difficult to utilize during non-peak hours. This factor was frequently discussed during the pandemic to incentivize social distancing, but as things have returned to normal and operators have seen their costs increase significantly, countries like Northern Ireland have instead moved away from the factor and eliminated their early bird ticket options. Our models suggest that peak pricing could be efficient in moving journeys, as more than 10% of journeys moved to off-peak in our simulations when introducing time differentiation.
The clear downside of time differentiation is that it punishes those who cannot adjust when they travel, including some low-income travelers, and can therefore be viewed as unsocial. According to our survey, travelers understood why peak pricing is a reasonable factor, but they were sympathetic to those without choice. Overall, the factor received a very negative score from customers. In addition, all routes in a system do not have the same issues with congestion and therefore do not have the same need for time differentiation. In certain areas it would therefore add complexity without solving a problem.
Mode differentiation
The final factor for our discussion is mode differentiation, or different prices for different vehicles in the mobility system. The rationale for this factor is that all modes do not have the same quality or cost of operation, and differentiation modes could therefore balance demand while reflecting the cost of operation in ticket prices. The factor is generally most relevant in mobility systems where trains are included, as long journeys could be disproportionately cheap in some price models.
Our simulations show that mode differentiation is effective in balancing demand between modes, but the added complexity is not appreciated by travelers. In our survey, respondents point to mode differentiation as more negative than time differentiation, as they highly appreciate a seamless mobility system.
4
DESIGNING IDEAL FARE MODEL
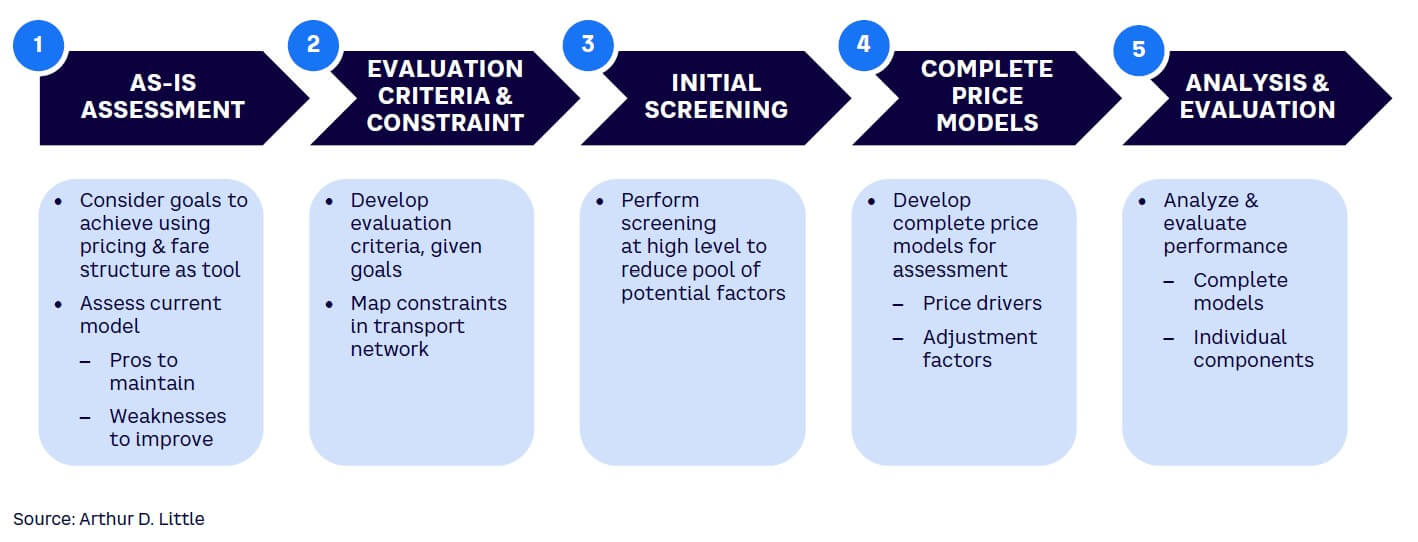
To help determine which model is the best fit, ADL has developed a five-point framework for PTAs to design the best fare model for their transport system (see Figure 6):
-
Assess current model’s achievement of travel transport goals. This as-is assessment provides the foundation for what should be improved by implementing a new price model.
-
Develop evaluation criteria and assess constraints. The criteria to evaluate potential fare models should reflect what the PTA wants to achieve with the fare model. As mentioned, a fare model is not fit to solve all problems in a transport system, and the PTA should be clear about its ambition. Given the wide impact of public transport, there could typically be upward of 20 criteria to asses the fare models, ranging from user friendliness to flexibility for political steering. The assessment criteria should therefore be prioritized to ensure efficient evaluation.
In this step, PTAs should also map constraints for a new fare model. Depending on the transport system, the PTA will have contracts that determine which fare models are applicable. There could, for example, be legal constraints on the types of solutions that can or must be provided, technical limitations in the system or among users, income demands, or other constraints. These should be mapped to enable the initial screening to be conducted with as little effort as possible.
-
Perform initial screening of fare model elements. This Report has discussed some price drivers and adjustment factors, but significantly more options are possible. In the initial screening, the first long list of relevant price elements should be reduced to a manageable number to evaluate in detail. The constraints and a rough assessment of the evaluation criteria are guiding factors in this phase.
-
Develop complete price models. In order to properly evaluate fare model elements, PTAs must assess them in the context of a complete price model. At the same time, evaluating price models in detail is a time-consuming activity, so to limit the effort needed, PTAs must develop complete and precise price models. With the correct assembly of price models, a PTA can assess the impact of each relevant element individually.
-
Analyze and evaluate price models. PTAs should employ a combination of qualitative and quantitative methods to evaluate the combined price models. A transport model is a highly valuable tool to assess the quantitative effects. Using historic travel data from the transport system combined with elasticity assumptions, PTAs can predict the quantitative effects of the user’s travel patterns due to different price models. If price elements in complete price models are accurately combined, the impact of each individual element can be seen. Based on this analysis, PTAs can assess the best combination of elements and create the ideal fare model for that specific area of operation.
Conclusion
The evolving landscape of public transport has brought forth challenges in funding and operational costs. A public transport fare model should align with the mobility system’s objectives, capabilities, and limitations. Despite regional differences, PTAs globally share common goals: to make mobility more environmentally friendly and offer straightforward, secure, and reliable travel in an efficient manner. Achieving these goals requires striking a balance with operation costs and public funding for services.
As we have illustrated in this Report, all price drivers and adjustment factors come with benefits and downsides. In addition to the general characteristics, factors can be designed to increase or decrease the effects by changing things like price levels, zone sizes, or distance. The effects can also be enhanced or canceled depending on what factors are combined. This results in a wide selection of considerations for PTAs when designing their fare model.
Our five-step framework guides PTAs during the process as they:
-
Assess current model.
-
Develop evaluation criteria and constraints.
-
Perform initial screening.
-
Develop complete price models.
-
Analyze and evaluate models and factors.
Using this framework will enable PTAs to design the fare model that works best for their public transport needs.
DOWNLOAD THE FULL REPORT
22 min read • Travel & transportation, Organization & transformation, Strategy
Public transport fare models
The right moment to revisit fare models & help transport authorities cope with challenges
DATE
Executive Summary
Since the COVID-19 outbreak and the war in Ukraine, the public transport funding equation has been challenged by new ridership patterns (impacting traffic and the level of adoption of subscription-based fares), inflation (raising the cost of operations), and an acceleration in the development of alternative transportation options (owned or shared). While price increases in public transport fares have been limited so far, we believe there is an opportunity to revisit fare models, as public authorities increasingly show a willingness to support multimodal integration and ticketing digitalization enables innovation in pricing and marketing. This Report identifies the need for public transport authorities (PTAs) to reassess fare models, leveraging digitalization and an increased willingness for alternative transportation models, and explores the following:
-
Public transport goals and potential measures. We discuss fare collection’s share of public transport financing and key levers to increase attractiveness for the transport network. We highlight some key considerations for PTAs when developing a fare model, while also keeping in mind that a model is just one of the tools a PTA has at its disposal to achieve goals.
-
Strong momentum for fare strategy redefinition. Recent events have increased the pressure on the public transport funding equation. With increasing operational costs, environmental transitioning, shared mobility, and integration of additional modes — alongside technlogical advances and changes in travel behavior following the pandemic — it is high time to revisit fare strategy, which for many PTAs has remained unchanged for a long time.
-
Fare models and adjustment factors. For a common vantage point for discussion, we present our definition of a price model and its design components. Furthermore, we provide an assessment of the general characteristics of the most common price drivers, including geographic zone–based models, distance-based models, personal zone–based models, and flat fare models. We also discuss the most common adjustment factors, loyalty factors, user types, and time and mode differentiation.
-
Designing an ideal fare model. Finally, to help PTAs design their ideal fare model, we present a five-step framework that provides a systematic approach to navigate the process effectively.
The Report emphasizes the array of benefits and drawbacks inherent in various price drivers and adjustment factors, offering PTAs a broad spectrum of options to construct their ideal fare model.
1
PUBLIC TRANSPORT GOALS & POTENTIAL MEASURES
The fare model is the core of any public transport network. In fact, fare collection often contributes as much as 20%-50% of the financing of urban transport network operating costs (see Figure 1). Affordability, readability, and simplicity of fares are levers for greater attractiveness.
A fare model for public transport should be designed in consideration of the mobility system’s goals, capabilities, and constraints. Although local variations exist, the overall public transport goals are generally the same for PTAs around the world: to make mobility more environmentally friendly and provide simple, safe, and predictable travel in an efficient manner. These goals are balanced against the cost of operation and public funding to provide the services.
While fare models can support the achievement of public transport goals, it is only one of many tools PTAs have at their disposal (see Figure 2). PTAs should therefore consider the available options based on what goals they want to achieve with their fare model, as no model is equipped to solve every challenge. For example, a typical conflict when discussing fare models is the trade-off between optimizing user behavior and simplifying the journey, since optimization often also adds complexity.
The capabilities of both the PTA and the users, together with the regulatory landscape, will set the boundaries for what solutions are possible for all aspects of the journey, including payment and ticket solutions, validation technology, and fare models. Many solutions are interconnected, so mapping the options based on the current solutions is important to understand what fare models are possible.
2
STRONG MOMENTUM FOR FARE STRATEGY REDEFINITION
CURRENT STATE OF AFFAIRS
There is strong momentum to revisit fare models given the ongoing funding challenges, expanded digitalization, changing mobility landscape, and evolving travel patterns. In recent years, the public transport funding equation has faced various challenges, including:
-
Rising operating costs. Since 2022, Le Parisien reports that PTAs and public transport operators (PTOs) have faced increasing operating expenses due to increases in energy prices (an increase of 1.6x for Paris Metro) and the impact of inflation on labor costs (an increase of 5.2% in 2022 for Paris PTO RATP Group) that could lead to increases in the hundreds of millions of dollars (an increase of US $219 million in OPEX in 2022 and $222 million in the first half of 2023 for RATP).
-
Green transition. In the medium term, different transportation networks will have to support higher investment to finance the green transition (e.g., bus fleets are expected to convert to electric, which may translate to higher CAPEX but lower total cost of ownership).
-
Changing scope of financing. PTAs in some regions are financing shared mobility (e.g., the integration of carpooling in the subscription-based product Navigo in Paris, France), though it comprises a low portion of the funding equation.
-
Integration of fares between modes and networks. Increasingly, PTAs and PTOs are seeking to integrate national, regional, and city-based transportation fares (e.g., Switzerland’s integrated fares system, Germany’s new Rail Pass, and upcoming projects in France that integrate regional trains and urban networks).
The available technology is also continuously evolving, affecting several aspects of the public transport journey. In our 2020 Arthur D. Little (ADL) Viewpoint “Dematerialized Ticketing,” we wrote about how server-centric ticketing allows the introduction of innovative pricing schemes as customers can be billed once they have completed their trips. The use of big data, artificial intelligence, and machine learning will allow more accurate predictions of customer behavior and improve several aspects of travel, including route optimization, the use of materials, safety, and the personalization of services. Within validation technology, Check-in/Be-out (CiBo) and Be-in/Be-out (BiBo) ticketing systems are continuously tested and can open the door for new pricing schemes once they become commercially viable, as models that previously required several interactions can now be automated.
The mobility landscape is increasingly being viewed as a single system. Going forward, we expect to see greater system integration. For public transport, this will likely mean integrating additional transport modes such as electric scooters for first/last-mile transport and eventually a fully integrated mobility-as-a-service network. For PTAs, this is a vital trend from a sustainability perspective to effectively fight the dominance of personal vehicles.
Finally, societies are returning to normal following the COVID-19 pandemic, when public transport was significantly affected by lockdowns, social distancing, and hygiene requirements. As societies reopen, most observers agree that at least some of the changes in behavior are expected to endure, as covered in the ADL Report “The Future of Mobility Post-COVID.” Among the expected lasting trends is the evolution of trip patterns, as customers are expected to repurpose, retime, and respace their travel patterns. With increased work from home expected to last to some degree, we anticipate customers will continue to repurpose their trips from work travel to more travel for home needs, respace their trips to shorter local trips, and use the increased flexibility to retime their trips by taking fewer trips during peak hours. This trend has a significant impact on what loyalty factor is the ideal choice for a transport network, but our analysis has shown it has less importance for the choice of price driver in the fare model.
3
FARE MODELS & ADJUSTMENT FACTORS
CONTENTS OF A FARE MODEL
To define a fare model, we begin with how the fare price of a journey is calculated. Fare calculation starts with a price driver, which is subsequently fine-tuned by one or a combination of adjustment factors, including time differentiation, user type, loyalty, and mode (see Figure 3).
A model’s price driver calculates a journey’s base fare (typically, the fare for an adult passenger). Depending on the model, the base fare would often have a variable component (distance/time/number of zones) and possibly a fixed component (starting price). The base can then be adjusted by a series of factors. The number of adjustment factors in a fare model varies, but a few are far more common and are the focus of this Report. In the following section, we discuss the pros and cons of the most common price drivers and adjustment factors.
In addition to the internal factors of a fare model, external factors also influence what models a PTA could utilize. A public transportation network’s characteristics (e.g., size, hilliness, congestion, and more) will influence what options are viable. The network’s financing model and its contributors will also influence the process and will likely guide the choice of fare model.
PRICE DRIVERS
The four price drivers we cover can be designed in several ways, but we aim to highlight the most general characteristics in this Report. Each driver comes with its own set of pros and cons but are all used in cities around the world in different combinations (see Figure 4).
Geographic zone
In a geographic zone–based model, the area is divided into separate geographic zones, typically centered around the area of the city that attracts the most trips. The traveler buys a ticket based on the number of zones that their trip covers.
This system is widely used around the world. It is predictable for consumers, as daily journeys will have the same fare, but can be challenging for passengers who don’t travel regularly, including tourists. To buy the correct ticket, a passenger must know where the zones are placed and where stations are located, which could be challenging for passengers unfamiliar with the system.
Another characteristic of this model is that short trips are relatively expensive compared to longer trips, as all trips within the zone cost the same. If the zones are large, one can travel longer distances for the same price as for a journey between two stations. This can be viewed as unfair by the travelers, but it also incentivizes journeys by walking and cycling on shorter distances and reduces the incentive to use personal cars on longer journeys, in line with public mobility goals. The position and size of the zones are important decisions when implementing the system, as changing the zone boundaries are difficult once they are established. Having more zones reduces the difference but also increases the system’s complexity and makes it harder to choose the correct ticket. This has been the argument for many mobility systems, as cities like Helsinki and Belgrade have reduced the number of zones in recent years.
One clear disadvantage is shorter trips across zone boundaries. Consumers starting their trips close to the edge of a zone will pay an unreasonably high price for short trips, both compared to the cost of the trip and compared to other passengers, which is perceived as unfair. However, there are ways to resolve this issue. For example, in the zone model implemented in Helsinki in 2019, all tickets cover at least two zones.
Distance-based
In a distance-based model, the fare and distance traveled are directly connected. The model typically calls for a minimum price in addition to a price per mile or kilometer, which could be regressive.
Distance-based fare models can be based on the actual distance traveled or the “air distance” (distance between two places drawn in a straight line) between the starting and ending location. Both are perceived as fair by consumers as they pay only for their actual consumption. The models are also connected to the variable costs of operation, especially models using actual distance traveled. This aligns the interest of the consumer and producer to a larger degree.
The differences between the two model options are minor. A downside for using a model based on actual distance is that consumers can perceive it as unfair for transport options that do not take the most efficient route, which increases the fare. Similarly, air distance models could see consumers pay significantly less than the actual distance traveled if the route contains detours and therefore does not reflect the journey’s production cost.
A downside for both models is that both the start and end positions must be registered for every journey in order to calculate the correct fare. This makes the model more suited for barred systems (where physical gates are present) using currently available technology. When technology for automatic registration of journeys like CiBo/BiBo becomes commercially viable, the customer experience in an honor-based (non-barred) system would significantly improve.
Personal zone
A personal zone model can be viewed as a mobile geographic zone model or a distance-based model, with larger distance intervals. One such model was introduced in 2017 in the Skåne region in Sweden, which includes the city of Malmö.
In general, a passenger is given a personal zone with a radius in which he or she can travel. Travel to a destination outside the zone has a higher price, similar to crossing a boundary in a geographic zone–based model. The difference is that the zones are based on the individual passenger instead of set positions.
One advantage of this model is that passengers won’t cross any boundaries during short trips, which can happen with static geographic zones. The size of the personal zone can also be adjusted based on the area of origin, as trips in rural areas are generally longer in distance than densely populated areas. The zone could either be bound to the person or to the individual ticket. If connected to the person, travelers could customize the model to fit their own preferences, placing their personal zone in the area most beneficial for them.
Digital maturity is important in implementing this model, as it is difficult for customers to know where the boundary of their personal zone is without a mobile ticket. Another challenge is that passengers may not be aware of the length of their trips and whether their daily commute will require a ticket valid in one or more zones. In total, the model requires high-quality interfaces, support, and publicity to implement.
Flat fare
In a flat fare model, there is a single price for tickets valid in the entire area of operation. The major upside of this model is the simplicity, which is the main argument for PTAs that have implemented it, including Stockholm. In Germany, PTAs have even introduced the Deutschlandticket, which provides access to public transport throughout the country.
Depending on the size of the area, the flat fare model gives customers the chance to travel long distances for a relatively low price, while charging the same price for short trips. This model aligns with many PTAs’ goal of increasing the share of travel by bicycle and walking while reducing the market share of cars.
Another argument in favor of this model is that short trips most often occur in urban areas, where the travelers have access to a vast array of travel options and modes with frequent departures, while trips in rural areas are typically longer, less frequent, and involve less efficient modes of transport. However, if the area of operation is of a significant size, the relative price difference for long trips would be disproportionally large and hence may be perceived as unfair.
A way to mitigate this price difference is to add a time limit to tickets, which hinders the option of traveling across the entire area. The traveler then must buy another ticket if his or her trip exceeds the limit, functioning similarly to a zone boundary in a geographic zone model. The advantage of this model is simplicity. There is only one price for the traveler to be aware of, as well as the potential time limit. The purchase of a second ticket could be done when needed, and alerts or similar solutions could make the traveler aware of additional purchase requirements.
The simplicity, however, often comes with a minor increase in price for most journeys compared to employing more complex models. This is because there is less price differentiation in the model, bringing all prices closer to the mean. Our customer survey implies that customers welcome the simplicity of a flat fare model but are concerned about the potential price increase on short journeys, which would affect most travelers.
ADJUSTMENT FACTORS
Most PTOs use adjustment factors in their fare models. The most common types are loyalty benefits (adjustment factors that reduce the price of travel based on frequent journeys) and user type, but in this section, we also discuss some less frequently used adjustment factors (see Figure 5).
Prepaid travel cards
Prepaid travel cards are still the most common form of loyalty, giving the passenger unlimited journeys for a set period. Alternative durations are typically offered, ranging from 24 hours to 365 days, but the 30-day pass is the most widely used. The prepaid travel card is very easy to use and doesn’t require validation for every journey in a non-barred system and provides an attractive offering to frequent travelers due to the high discounts that are possible.
At the same time, prepaid travel cards have some well-known downsides. The pandemic and associated increase in working from home demonstrated that this form of loyalty is less well-equipped to incentivize a more flexible and unpredictable travel pattern. To garner loyalty benefits, the traveler must know in advance that he or she will travel a certain number of trips in the coming period, which can make it difficult for users to determine the investment’s worth. High up-front costs also make it difficult for low-income groups to utilize the system. The final downside is that journeys could be perceived as free, increasing the portion of short journeys that could have been taken by bicycle or on foot instead, increasing congestion in public transport.
Capping
A fare-capping model has been introduced in many cities around the world, including London, Malmö, and Victoria. The model sets a maximum amount a traveler can spend per day/week/month, effectively functioning as a prepaid travel card once travelers have reached their cap. Its effect on travel behavior is also similar to the prepaid travel card model, with some differences.
One advantage of fare capping is that travelers don’t need to determine in advance their travel needs for a given period. The cap ensures that customers always receive the best price possible. Like the prepaid card, it also gives a significant benefit to the most frequent travelers, as every additional journey beyond the cap is free.
However, the added benefits do add some complexities. In non-barred mobility systems, travelers would have to purchase a ticket at every journey until they have achieved the cap. Our simulations also show that implementing a cap compared to prepaid travel cards requires a minor increase in prices to maintain the same revenues. This is a result of travelers who miscalculate their travel needs and therefore purchase non-optimal tickets. Also, some travelers are willing to pay a little extra for a prepaid ticket to avoid purchasing a ticket at every journey.
Customers generally perceive capping as a suitable alternative in times where their travel needs are uncertain, but in a non-barred system, they are reluctant to having it as the only loyalty alternative, as they enjoy the simplicity in the prepaid card and don’t want to purchase a ticket at every journey.
Membership
For some time, a membership model has been considered for public transport, but to our knowledge it has not yet been implemented in any mobility systems. With a membership, travelers pay a monthly amount to access cheaper single fare tickets. While most changes in recent years have been in the direction of simplification, a membership model would instead focus on optimization, but it comes with an added layer of complexity.
Assessing whether a membership is worth the investment is harder than assessing a prepaid travel card, since it includes the cost of subsequent journeys. This was evident in our customer surveys, where many respondents were confused as to how the model would work. Similar to capping, the model would also require a ticket at every journey, which is a hurdle for travelers in non-barred systems.
The benefit of the model is that more travelers enjoy loyalty benefits. Our simulations showed that with a membership costs 50% lower than a prepaid travel card, single ticket prices could be reduced by 80%. This significantly reduced the prices for customers taking two to three journeys a week without necessitating a significant increase in prices for more frequent travelers. The model increased the market share of public transport compared to cars, since longer journeys became cheaper, while also increasing the market share of walking and bicycles because every journey, including the shortest, had a price.
Quantity discounts
The final loyalty factor we will discuss is quantity discounts. Prepaid single ticket quantity discounts have been common in mobility systems for some time, but with developing technology, more advanced, seamless pay-as-you-go alternatives have become available. In our simulations, the quantity discount model was designed to give an increasingly higher discount for each journey taken within a given period. This required the travel card to be connected to an account to register the benefits.
The model’s advantage is that every traveler taking more than one journey during the time period achieves loyalty benefits. To maintain income levels, however, this means that the most frequent travelers had an increase in price, even with quantity discounts as high as 80%. The low amount of journeys needed to attain a sufficient discount proved to outweigh the cost of the prepaid travel card. Similar to capping, the model also secures the best possible price for every traveler.
Again, the model also requires the purchase of a ticket at every journey, and the price of the journey becomes less predictable. This means that the model is better suited in a system where journey registration occurs automatically.
User type
Another adjustment factor that most transport systems use are discounts for different user types. This could be tickets for children, students, senior citizens or pensioners, or another group, increasing access for these participants to the public transport system. User type discounts are generally assumed in mobility systems, but one user type discount has received some debate in recent years. Historically, senior citizens were among the lowest earners in most countries, but with the increase in living standards and property prices in recent decades, pensioners are now among the wealthiest groups in many countries. The question of whether senior citizens need an added discount for public transport services has therefore been a point of discussion; however, our simulations show that changing the discount for pensioners has a low overall impact on the mobility system, and removing the option is perceived negatively.
Time differentiation
A more controversial factor, which some cities have introduced and that could become more popular in the future, is peak pricing, or time differentiation. Nudging travelers to off-peak journeys both reduces congestion and is financially beneficial for the system because peak hours often require additional capacity that is difficult to utilize during non-peak hours. This factor was frequently discussed during the pandemic to incentivize social distancing, but as things have returned to normal and operators have seen their costs increase significantly, countries like Northern Ireland have instead moved away from the factor and eliminated their early bird ticket options. Our models suggest that peak pricing could be efficient in moving journeys, as more than 10% of journeys moved to off-peak in our simulations when introducing time differentiation.
The clear downside of time differentiation is that it punishes those who cannot adjust when they travel, including some low-income travelers, and can therefore be viewed as unsocial. According to our survey, travelers understood why peak pricing is a reasonable factor, but they were sympathetic to those without choice. Overall, the factor received a very negative score from customers. In addition, all routes in a system do not have the same issues with congestion and therefore do not have the same need for time differentiation. In certain areas it would therefore add complexity without solving a problem.
Mode differentiation
The final factor for our discussion is mode differentiation, or different prices for different vehicles in the mobility system. The rationale for this factor is that all modes do not have the same quality or cost of operation, and differentiation modes could therefore balance demand while reflecting the cost of operation in ticket prices. The factor is generally most relevant in mobility systems where trains are included, as long journeys could be disproportionately cheap in some price models.
Our simulations show that mode differentiation is effective in balancing demand between modes, but the added complexity is not appreciated by travelers. In our survey, respondents point to mode differentiation as more negative than time differentiation, as they highly appreciate a seamless mobility system.
4
DESIGNING IDEAL FARE MODEL
To help determine which model is the best fit, ADL has developed a five-point framework for PTAs to design the best fare model for their transport system (see Figure 6):
-
Assess current model’s achievement of travel transport goals. This as-is assessment provides the foundation for what should be improved by implementing a new price model.
-
Develop evaluation criteria and assess constraints. The criteria to evaluate potential fare models should reflect what the PTA wants to achieve with the fare model. As mentioned, a fare model is not fit to solve all problems in a transport system, and the PTA should be clear about its ambition. Given the wide impact of public transport, there could typically be upward of 20 criteria to asses the fare models, ranging from user friendliness to flexibility for political steering. The assessment criteria should therefore be prioritized to ensure efficient evaluation.
In this step, PTAs should also map constraints for a new fare model. Depending on the transport system, the PTA will have contracts that determine which fare models are applicable. There could, for example, be legal constraints on the types of solutions that can or must be provided, technical limitations in the system or among users, income demands, or other constraints. These should be mapped to enable the initial screening to be conducted with as little effort as possible.
-
Perform initial screening of fare model elements. This Report has discussed some price drivers and adjustment factors, but significantly more options are possible. In the initial screening, the first long list of relevant price elements should be reduced to a manageable number to evaluate in detail. The constraints and a rough assessment of the evaluation criteria are guiding factors in this phase.
-
Develop complete price models. In order to properly evaluate fare model elements, PTAs must assess them in the context of a complete price model. At the same time, evaluating price models in detail is a time-consuming activity, so to limit the effort needed, PTAs must develop complete and precise price models. With the correct assembly of price models, a PTA can assess the impact of each relevant element individually.
-
Analyze and evaluate price models. PTAs should employ a combination of qualitative and quantitative methods to evaluate the combined price models. A transport model is a highly valuable tool to assess the quantitative effects. Using historic travel data from the transport system combined with elasticity assumptions, PTAs can predict the quantitative effects of the user’s travel patterns due to different price models. If price elements in complete price models are accurately combined, the impact of each individual element can be seen. Based on this analysis, PTAs can assess the best combination of elements and create the ideal fare model for that specific area of operation.
Conclusion
The evolving landscape of public transport has brought forth challenges in funding and operational costs. A public transport fare model should align with the mobility system’s objectives, capabilities, and limitations. Despite regional differences, PTAs globally share common goals: to make mobility more environmentally friendly and offer straightforward, secure, and reliable travel in an efficient manner. Achieving these goals requires striking a balance with operation costs and public funding for services.
As we have illustrated in this Report, all price drivers and adjustment factors come with benefits and downsides. In addition to the general characteristics, factors can be designed to increase or decrease the effects by changing things like price levels, zone sizes, or distance. The effects can also be enhanced or canceled depending on what factors are combined. This results in a wide selection of considerations for PTAs when designing their fare model.
Our five-step framework guides PTAs during the process as they:
-
Assess current model.
-
Develop evaluation criteria and constraints.
-
Perform initial screening.
-
Develop complete price models.
-
Analyze and evaluate models and factors.
Using this framework will enable PTAs to design the fare model that works best for their public transport needs.
DOWNLOAD THE FULL REPORT
RELATED INFORMATION

Digital business models in freight

Successful Public-Private Partnerships
Public-private partnerships (PPPs) are an essential tool to satisfy and advance infrastructure needs worldwide. If planned, designed and implemented properly, PPPs can contribute to national…

Journey 2.0 in sustainable transport
A new study by Arthur D. Little explores some emerging threats to revenues in the transport sector and investigates potentially significant business opportunities to overcome these. The white paper…