

There is an intrinsic need for strong risk management as a part of good overall corporate governance — a business has a duty to protect its workers, community, customers, and shareholders. As we show in this Viewpoint, the TCOR (total cost of risk) methodology recognizes this imperative while also establishing a business case for risk management based on the principle that spending money to reduce risk exposure can pay dividends in reduced costs.
ORIGIN OF THE CONCEPT
The term “total cost of risk” is attributed to Douglas Barlow, insurance-cum-risk manager for Toronto, Canada, manufacturer Massey-Ferguson, in 1966. Barlow articulated the need for companies to understand risk-related costs in their entirety, rather than solely focusing on insurance. It was a new and genuinely holistic performance measurement tool that prompted a significant advance in the sophistication of risk management.
At the time, Barlow defined “cost of risk” as the sum of insurance premiums, self-insurance costs, risk-control expenditures, and administrative costs.[1] His vision was to compare the value of this measure to that of the assets and revenues of a company, and it continues to be a useful internal and external benchmark for performance measurement. For example, some industry TCOR surveys record total cost of risk per US $1,000 of revenue such that organizations across various industries may compare their performance.
Despite its utility, TCOR is often underutilized in risk management today, due in part to the challenges of its implementation and a misunderstanding of its requirements, especially in relation to data needs.
CHALLENGES OF LEVERAGING TCOR
Organizations are in constant tension between the requirements to minimize nonessential spending and to demonstrate tangible and constant improvement in their operations. This tension may be exacerbated by deep-rooted expectations from senior stakeholders — for example, the perception of risk spending as “discretionary.” Resolution around this tension is possible through adopting a TCOR-centric approach, but there are several known challenges associated with its implementation:
-
Additional costs. Changing a business’s approach to risk management inevitably carries additional cost, whether the direct cost of new risk controls or the indirect costs of any wider organizational changes. Potential value needs to be evaluated against these additional costs.
-
External factors. Making predictions about tangible value is inherently difficult; costs driven by external factors can be unpredictable and may be influenced by unknown unknowns.
-
Seeking value in the wrong places. Organizations that implement a TCOR-centric approach may be unfamiliar with where to expect value to emerge.
-
Stakeholder management. Risk managers are required to demonstrate benefit to stakeholders throughout the risk management cycle. Failure to do so can create barriers to further progress and may thwart the process altogether.
RISK ACCEPTANCE & RISK MANAGEMENT TRADE-OFF
TCOR can be considered as the sum of the costs of activities to manage or transfer risk, and of actual losses and exposure to residual risk.
Risk acceptance & transfer
Risk transfer involves arranging for a third party (e.g., an insurer) to absorb some or all of one’s exposure to a particular risk. Any remaining costs borne by the organization due to risks not otherwise managed or transferred are the cost of risk acceptance. In the absence of any measures to manage or transfer a risk, it sits entirely within the category of “risk acceptance.”
Risk management
Risk management costs are those associated with trying to lower one’s exposure to risk. Risk management may involve “hard” engineered systems and/or “soft” business processes and behavioral controls. Many companies have a dedicated risk management function as part of their organization and/or outsource to a third party.
Trade-off at play
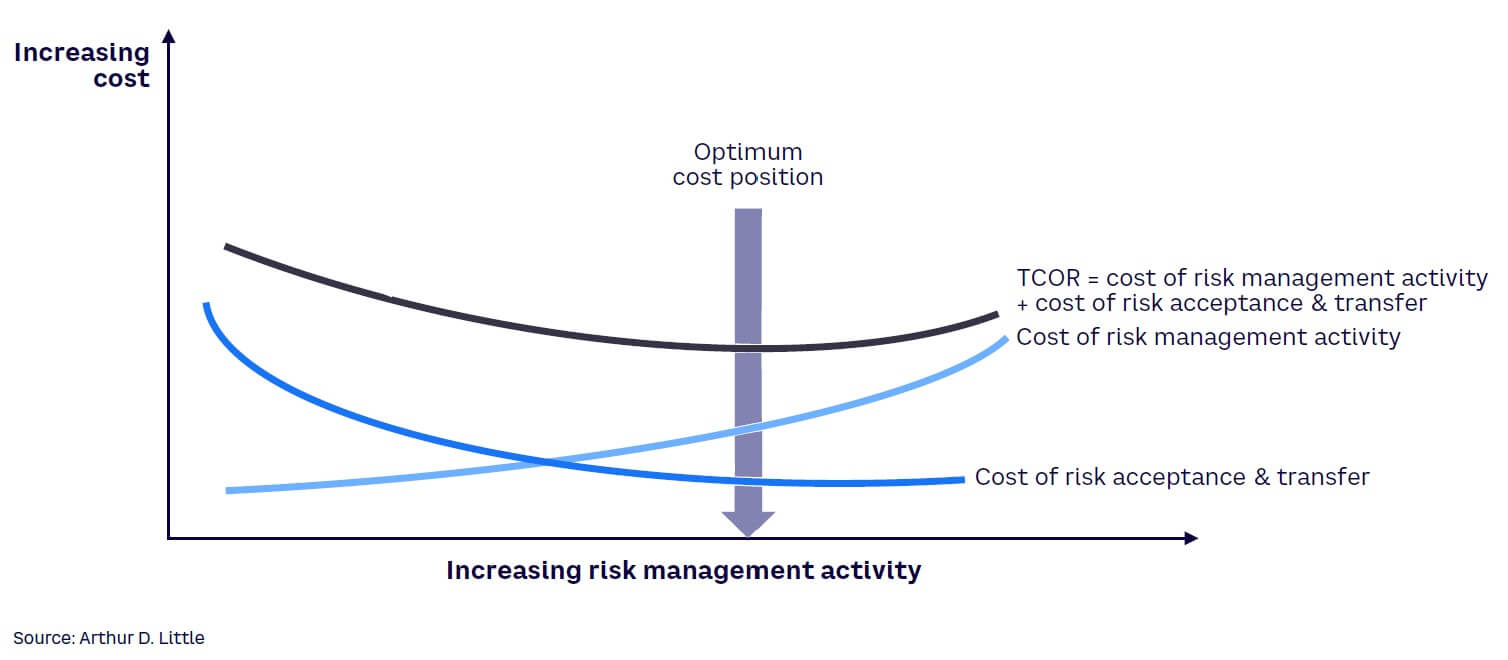
Between these two components, there is an inherent trade-off. There are major potential costs associated with failing to manage the risk sufficiently, which are reflected in a high cost of acceptance or transfer of risk (e.g., due to a high number of workplace accidents). Conversely, overmanagement of risk will incur disproportionate costs of risk management activity.
The trade-off demonstrates how an “optimal” level of risk management can minimize the TCOR (see Figure 1). The TCOR methodology provides a valuable tool for organizations to identify and achieve this optimum cost position.
TCOR IN DETAIL
The two components of TCOR — risk acceptance/transfer and risk management — can be broken down into six key elements (see Figure 2), which we have expanded from Barlow’s original concept. These six elements form the basis for a TCOR formula tailored for a given organization. Applying the TCOR methodology supports an organization in identifying its cost profile for each element and enables it to establish and move toward the optimal cost position.
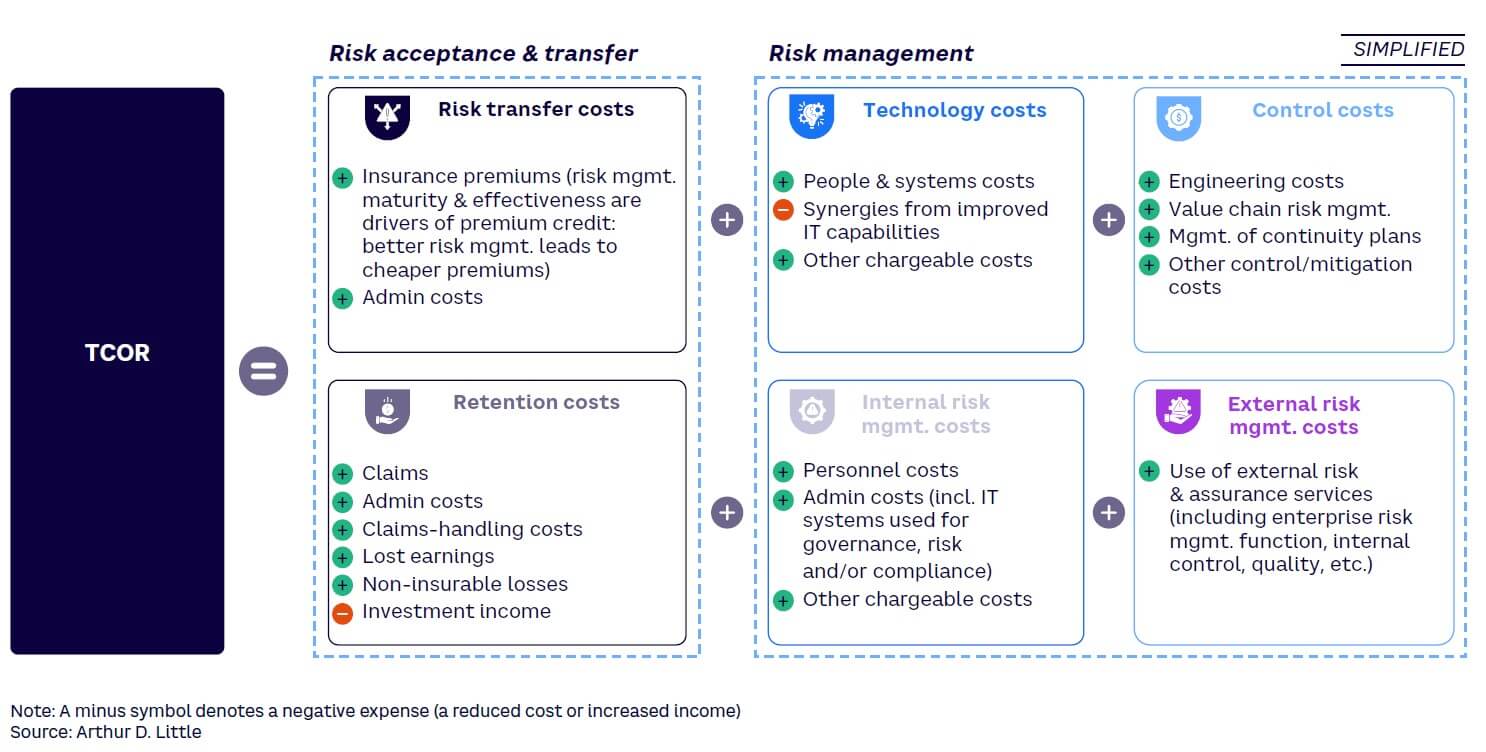
It is important to note that the TCOR elements are interconnected, with changes to one generally causing variations in the others. For instance, a reduction in external risk management expenditure will be offset by an up-front increase in personnel or technology costs, but over time may reduce the total cost profile. These relationships and the TCOR equation itself are highly specific to individual organizations.
1. Risk transfer costs
These consist primarily of insurance premiums for various coverage types and can be reduced if an organization is able to demonstrate suitable risk management measures. The converse is also true: insurers will err on the side of caution and charge businesses for more coverage than they may need, and at a higher rate, if there is poor evidence of risk management.
2. Retention costs
These consist primarily of claims costs and other direct costs of uninsured adverse events, such as loss of income. They represent the risk exposure that remains after accounting for all risk management and transfer. Effective management of the retained risk profile can reduce administrative and legal costs, as claims can be handled more efficiently and can reduce earnings volatility by providing a more credible picture of risk to external stakeholders.
3. Technology costs
The focus of this element is on specialist systems and direct operational technology, which are used to monitor and manage risk. Increased technological capacity can support an organization’s resilience, such as in the context of a shock event (e.g., a pandemic). The benefits of improved digital maturity are not limited to increased synergy — other benefits include strong cybersecurity, improved customer experience, and access to cloud technologies. Across the spectrum, digital maturity is often perceived to be indicative of the maturity of the whole organization (including in risk control and risk management).
4. Internal risk management costs
These consist primarily of personnel costs, which include salaries of risk-focused employees and employers’ overhead costs, such as recruitment or internal training related to the risk management strategy. Personnel costs also include factors such as lower productivity and employee absenteeism. Aside from personnel costs, internal risk management includes essential administrative technology, such as access to operating systems and population of risk registers.
5. Control costs
Control costs are any that relate to monitoring the status of a process or workstream. Simply put, these are the costs of an organization’s engineering and business processes, elements of which include performance reviews, business continuity reviews, forecasting, and system management reviews. Analysis of the cost profile relies on the quality of inputs and outputs. In the absence of good quality data, and to avoid increased risk exposure, organizations will find their control costs increasing. This can be thought of as offsetting the deficit in risk visibility with expenditure.
6. External risk management costs
These include consultancy fees, external risk and audit services, management outsourcing, and legal representation. In addition, internal functions such as treasury and enterprise risk management (ERM) may be outsourced. It can be beneficial to use external risk services, such as consultants, to perform independent maturity assessments and drive year-on-year improvement through the introduction of new and appropriate methodologies and techniques. However, for many businesses, it will be more appropriate to limit external risk management expenditure by becoming more self-sufficient.
TCOR LEVERAGED SUCCESSFULLY
Across multiple industries, companies have attained significant benefits using a TCOR approach. The US Occupational Safety and Health Administration (OSHA) publishes statistics evidencing the business case for proper safety risk management. The organization found, through a survey of CFOs, that every $1 invested in injury prevention returns $2 or more. OSHA also published a case study of a small US business that saved over $1 million in workers’ compensation and other costs over a five-year period by investing approximately $50,000 in safety improvements and employee training costs — a 20:1 return.
A UK passenger train operating company invested ~$270,000 in training, over a five-year period, of 200 managers in accident investigation. The company’s head of safety and security reported that the training had a very short payback period. Managers who received the training were better equipped to collect evidence from passenger incidents, which improved the organization’s ability to settle valid claims quickly while more robustly refuting opportunistic or fraudulent ones.
CASE STUDIES: TCOR IN ACTION
X Transport
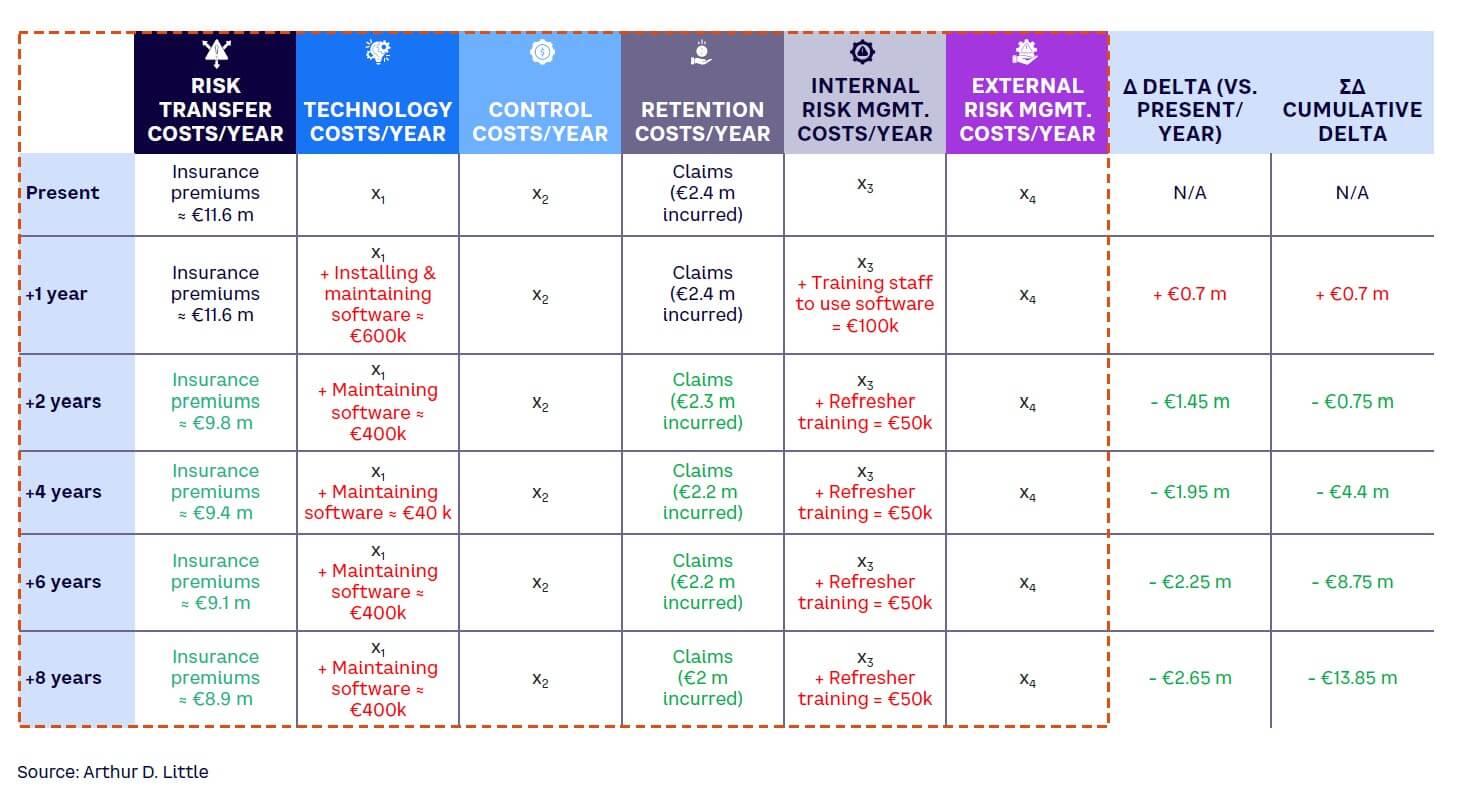
X Transport is a medium-sized school bus and private transport operator in Europe. The business employs 1,073 frontline staff (774 drivers, 299 “monitors”) to staff its 1,000 vehicles, including 475 buses, 504 vans, and 21 SUVs. In 2022, X Transport took €97 million (~US $106 million) in revenue. X Transport intends to invest in its safety program and wants to use the TCOR model to demonstrate a return on investment. Specifically, the business is implementing new fleet management software in its vehicles to reduce its insurance and claims expenses.
While the change to the TCOR profile of X Transport will not affect every element in the TCOR equation, Table 1 highlights the annual change in value for each element in red (if increasing) or green (if decreasing). Constants are represented as x1,2,3….
The implementation of the fleet management software carries a net cost in the first year after the change. After two years, reduced insurance premiums and claims costs provide a cumulative net savings of €0.75 million (~US $0.82 million), rising to €13.85 million (~US $15.1 million) over an eight-year period.
Analysis
Representative and realistic values for X Transport were used to calculate the expected TCOR savings. Insurance premiums assume an average cost of €50 (~US $55)/day/vehicle, with vehicles on the road on average 230 days of the year, yielding a baseline figure of €11.6 million (~US $12.7 million) per year. The fleet management software is priced on average at €25 (~US $27)/vehicle/month, totaling €300,000 (~US $327,000)/year, not including the installation cost.
There are two benefits of TCOR that are not included in the above calculation:
-
Reputational benefits leading to increase brand value due to safety improvements, which can be amplified with effective marketing
-
Behavioral changes from drivers leading to better fuel economy and reduced maintenance costs
The focus of this analysis is on an eight-year time frame, after which savings are expected to level off.
Y Energy Co.
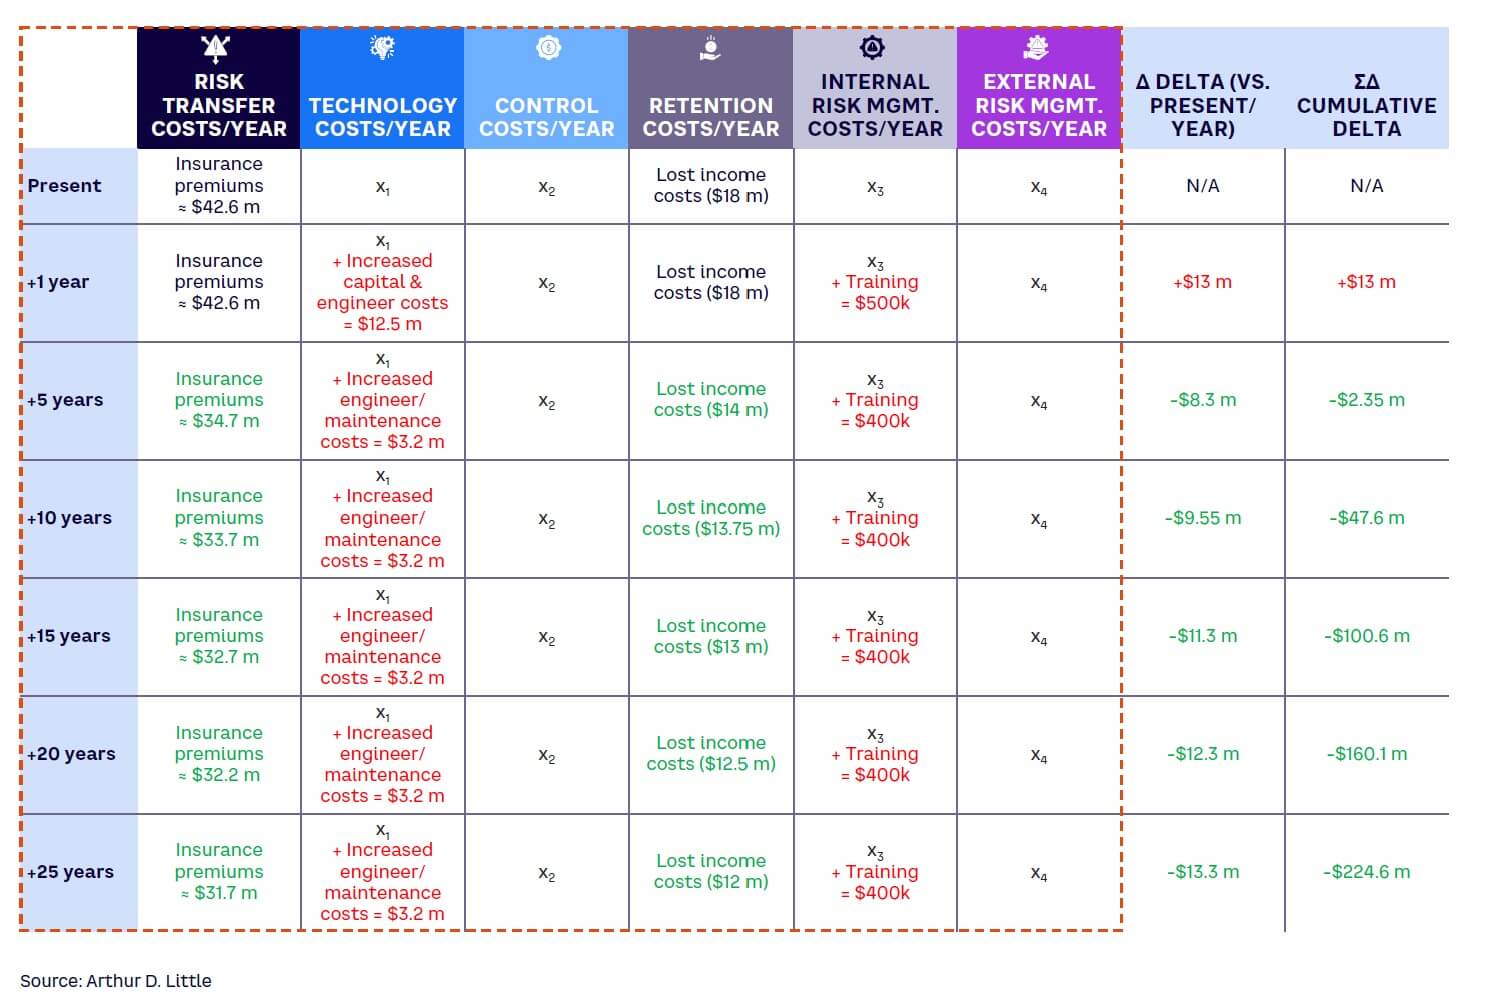
Y Energy Co. is a medium-sized upstream oil producer operating in the Americas. In 2022, the business generated revenue of $841 million, producing 8.3 million barrels of crude oil and 3.8 million barrels of high-end refined oil. It employs 1,524 staff (1,214 engineers, 310 non-engineering staff).
Y Energy Co. is introducing a new risk management process that will increase investment in engineering costs to maintain/fix production-critical equipment. As a result, Y Energy Co. expects to reduce its insurance premiums and lost income costs. The business utilizes a TCOR approach to show value over a 25-year period (see Table 2).
The new process incurs a net cost of $13 million in the first year, but after five years this is reversed to a $2.35 million cumulative net benefit. At the end of the 25-year period, Y Energy Co. has made TCOR savings of $224.6 million.
Analysis
Y Energy Co.’s annual insurance premiums include movement (and installation), breakdown, and business-interruption risk, as well as specialized risk (e.g., cyber) for specific production-critical equipment. The periodic increased engineering costs equate to biannual training fees of ~500 prioritized safety-critical engineers, equating to $2 million ($4,000/engineer).
There are several benefits to Y Energy Co. that are not represented in the above TCOR calculation:
-
Reduction in safety incidents and their associated legal and reputational impacts
-
Decreased negative attention from governments, regulators, and industry bodies due to adverse events involving production-critical equipment
-
Reduced downtime of production-critical equipment and associated benefits to consumers/communities
The focus of the analysis is on a 25-year time frame due to the long-term expected benefits of the change. From client experience, TCOR savings from such circumstances can expect to level off after 25 years.
General benefits
The bulk of the reduction in TCOR for these companies is driven by a reduction in insurance premiums as the insurer reacts to the reduction in risk of payouts on their part. For both case studies, which were based on real client cases, we made the following assumptions:
-
There are no unexpected market events or conditions that have a bearing on the relevant merits of the scenarios being considered.
-
Inflation has been excluded.
Conclusion
TCOR: Key takeaways for senior management
In principle, effective risk management can pay dividends in cost savings. Practical application of this principle to management decisions about what activities to pursue, and the extent to which they are followed to optimize costs, is far more difficult. TCOR is a valuable tool for developing a comprehensive view of risk but may also present challenges that require further maturing of the culture and processes around risk management. The TCOR methodology, applied consistently and regularly, provides a basis for organizations to:
-
Develop the business case for risk management activity.
-
Build stakeholder confidence that risk is being managed appropriately.
-
Better understand the wider implications of risk decisions.
-
Improve business performance as a result of better decision-making and reduced costs — especially if applied repeatedly over longer time frames to monitor and drive improvements.
Note
[1] Kloman, H. Felix. “Rethinking Risk Management.” The Geneva Papers on Risk and Insurance, Vol. 17, No. 64, July 1992.
Unlock a Powerful Difference
RELATED INFORMATION

AIM for Risk Management
In the future the changing risk profile of a business will be used as a tool in day to day management. The steady increase in data available on companies’ assets (both tangible and intangible)…

Risk as a value generator
Boards and investors of leading corporations are necessarily becoming more active in risk management. However, effectively tackling what are often unforeseen risks is increasingly challenging as the…

From risk to resilience: Digital defense
There is no doubt that while the world is enjoying the benefits of the fourth industrial revolution, the risks to businesses from cyber-threats are increasing in both sophistication and frequency.…